If you haven’t done so already, we strongly recommend starting off with our “Axes” article, which teaches the basics of Axis management, and also touches this topic briefly.
Each axis, regardless of its type, is divided into some logical increments - cells.
For a Category axis, that would be category. For a Date axis - a date increment related to your data, say a day.
As you may already know if you have been working with axes, all appearance-related settings are set on an axis’ “renderer”, accessible via renderer property. (more about renderers)
Visual elements of the axis are stored in renderer’s properties as template lists, e.g.: axis.renderer.grid.template has a template object for axis grid elements. A template for labels is stored in axis.renderer.labels.template. Similarly, ticks can be configured via axis.renderer.ticks.template.
Each of those templates have a location property, which will be the centerpiece of this section.
location is a relative value, defining elements position withing particular cell.
The range of location values is from 0 to 1.
0 means start of the cell, while 1 means end of the cell. Any value in-between will mean relative position withing cell. E.g. 0.5 will position element directly in the middle of the cell.
Technically, you could go beyond the 0-1 range in both directions, to place elements outside cell. However, in practice, such requirement is hard to imagine.
OK, so now that we know theoretical concept of “location”, let’s put it to practice.
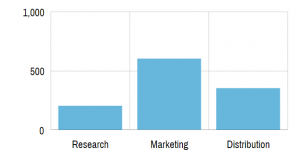
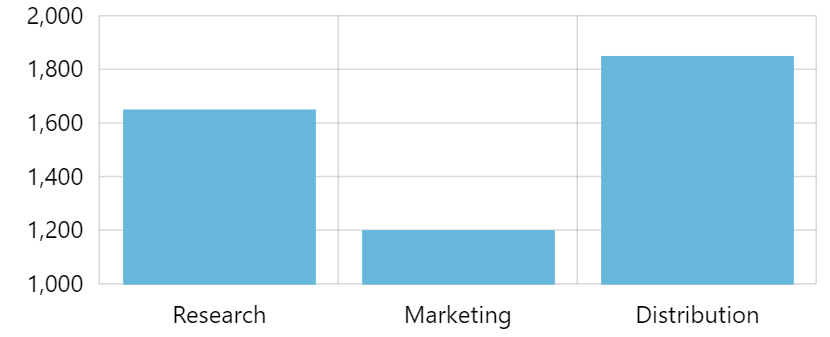
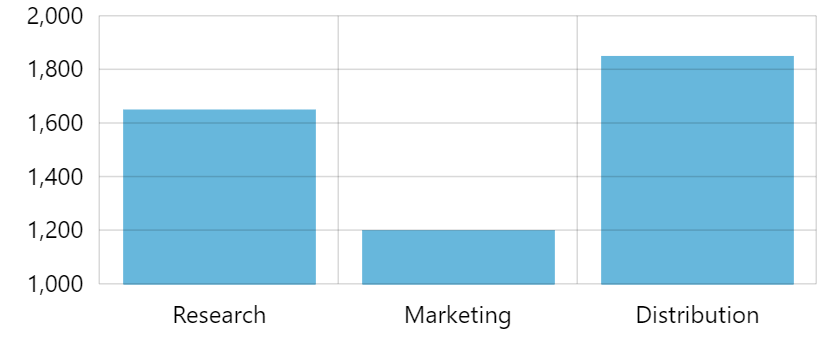
By default, grid elements are placed in the middle of the cell (location = 0.5), which does not work very well for Column series:
"Apple Color Emoji", "Segoe UI Emoji", "Segoe UI Symbol";
}
#chartdiv {
width: 100%;
height: 250px;
}
Axis element locations (2)axis-element-locations-2
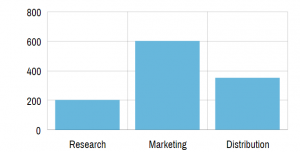
Now that’s better!
Similarly, if we wanted to change position of the labels to cell start, we’d use axis.renderer.labels.template.location. Or, for ticks: axis.renderer.ticks.template.location.
There’s one thing you should know about DateAxis and location of their labels.
When the chart is wide enough for DateAxis to display a grid line / label on every baseInterval, it will want to center the labels.
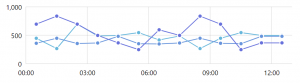
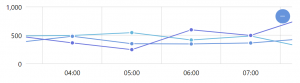
For example, if we have a chart with hourly data, and the chart can’t fit grid lines for every hour, it will display it in increments:
But once we zoom in, and the chart can fit labels for each hour:
This is not a bug, and is done intentionally. Since now the label represents full period so it makes sense to center it.
If you would still like to put the label back on grid line, we can use its location setting.
There is a catch, though. Since location default is 0 (zero), and we set it to zero as well, the DateAxis will not be able to distinguish from user-set zero from default zero, and will assume that it’s OK to go through with the fuzzy logic described above.
The workaround is to set it to a value that is very close to zero, say, 0.0001.
Actual behavior depends on available space. But it’s all governed by a single axis renderer’s property: minGridDistance.
In human language it means this: “Whatever happens DO NOT place two grid lines closer than X pixels. I’m serious, man!”.
Default settings depend on orientation. For example horizontal axis renderers (AxisRendererX) has a default of 120. Vertical axis renderer (AxisRendererY): 40.
Increasing these numbers will mean likely sparser grid lines and related labels. Decreasing will probably result in denser grid/labels.
Let’s try to trick our example from before to display more labels:
minGridDistance affects Value axis (and by extension Date axis) in a unique way.
Since this settings puts a restriction on how close two grid lines can be, naturally, this will affect number of grid lines.
This works in tandem Axis’ algorithm that strives to present axis scale (start and end values) as well as increments in nice round numbers.
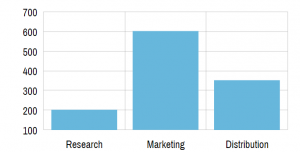
For example, if we have value ranges from 100 to 600 in our data, but minGridDistance setting allows to only display 3 grid lines. We may end up with a scale from 0 to 1000 with a grid line at 500 in-between.
But, if we space and minGridDistance setting allows for many more grid lines, we might end up with an axis that scales from 100 to 600 with a grid line every 100.
In short, minGridDistance might affect the actual scale of the Value axis.
Let’s put this to test.
In the below chart, we’ve set minGridDistance = 60. You’ll see how that affects scale of the axis, making it go from 0 to 1000. That is because, lacking permission display grid lines at smaller increments, axis reverts to increments of 500, hence the scale: (live example)
minGridDistance = 60
Now let’s try decreasing the number to 40 and see how the axis reverts to 200 increments, and scale of 0 to 800: (live example)
minGridDistance = 40
Let’s go one step further, make those labels even more denser at 20: (live example)
That means that series that display their data point in the middle of the cell, like Line series, will start and end some distance from the edge of the plot area:
"Apple Color Emoji", "Segoe UI Emoji", "Segoe UI Symbol";
}
#chartdiv {
width: 100%;
height: 200px;
}
Axis start position (1)axis-start-position-1
Date and Category axes (and possible other axis types in the future) has some means to control that in the form of two properties: startLocation and endLocation.
What they mean is you can specify exactly how much of the first and last cell you want to be visible.
dateAxis.startLocation = 0.5;
dateAxis.endLocation = 0.5;
dateAxis.startLocation = 0.5;
dateAxis.endLocation = 0.5;
{
// ...
"xAxes": {
// ...
"startLocation": 0.5,
"endLocation": 0.5
}
}
The above will mean that half of the first and half of the last cell is shown, making our Line series extend right to the edge of the plot area:
As we explained earlier, each axis is divided into cells.
On quantitative axis types, like Date axis or Value axis, cells are not important. Whereas on Category axis cells are very well defined.
Each category is a cell. Basically, a cell takes up the whole width allotted to a category.
Cell size affects its contents as well. For example, columns from Column series will be as wide as a cell. If we have several clustered columns, the cell will be divvied up equally for each of the columns:
"Apple Color Emoji", "Segoe UI Emoji", "Segoe UI Symbol";
}
#chartdiv {
width: 100%;
height: 200px;
}
Axis label control (1)axis-label-control-1
However, sometimes, especially in crammed spaces, you don’t have any padding around your plot area, and do not want labels to be cut off in the middle.
In those situations, disabling labels close to the start and end of the axis is a viable solution.
This can be done automatically by axis renderer. All you have to do is to tell renderer how close the labels has to be to the end of the axis to be deemed unworthy for being shown.
For that we have two renderer’s properties: minLabelPosition and maxLabelPosition.
Both of those settings can have ranges from 0 to 1 that are relative to the whole width of the axis. 0 signifies start of the axis, 1 - the end, 0.5 - middle, etc.
Setting the above properties will indicate the threshold along the axis’ length beyond which no label should be drawn.
For example minLabelPosition = 0.05 will disable all labels in the first 5% length of the axis. Similarly, maxLabelPosition = 0.95 will disable labels in the last 5% along axis length.
Let’s try to apply this to remove first and last label from the above example:
Sometimes, when you have a lot of labels, but don’t want to thing them out using grid/label spacing settings, you may turn to other solution - label rotation.
Placing labels vertically or at some angle will enable us to cram much more labels into the same horizontal space.
"Apple Color Emoji", "Segoe UI Emoji", "Segoe UI Symbol";
}
#chartdiv {
width: 100%;
height: 200px;
}
Axis label rotation (1)axis-label-rotation-1
We’ve intentionally lowered the minGridDistance setting so that we see all labels.
We do see all the labels, however, now they overlap. Not cool.
To rotate them we’re going to user renderer.labels.template, just like we used to adjust label position in previous sections.
The setting for rotation, which works on virtually all elements on amCharts 4 by the way, is predictably rotation. It’s a number in degrees (0-360) with zero being the vertical angle going up from the center.
Say we want to make our labels vertical. Setting their rotation = 90 will do the trick:
dateAxis.renderer.labels.template.rotation = 90;
dateAxis.renderer.labels.template.rotation = 90;
{
// ...
"xAxes": {
// ...
"renderer": {
// ...
"labels": {
"rotation": 90
}
}
}
}
TIP 0 to 360 is a full cycle. So if you want those labels to be flipped, just add 180. E.g. setting rotation = 270 will make labels vertical but facing the other way.
"Apple Color Emoji", "Segoe UI Emoji", "Segoe UI Symbol";
}
#chartdiv {
width: 100%;
height: 200px;
}
Axis label rotation (2)axis-label-rotation-2
OK, we do have our labels rotated, but their positioning seems to be off. They’re plopped directly on the axis, which is, again, not particularly cool.
This is happening because every element has its vertical and horizontal center. Controlled by verticalCenter and horizontalCenter properties respectively.
Available vertical center values are: "top" (default), "middle", and "bottom".
For horizontal center the choices are down to: "left", "middle" (default), and "right".
Since Axis renderer places its labels in some particular spot, which in our case is directly below the grid, its center will always be there. We can just change what is the center of the label - it will be rotated using that center as an anchor point.
So, when we rotate a label, who’s horizontal center is in the middle, we do get a label that now is partially overlapping the axis itself.
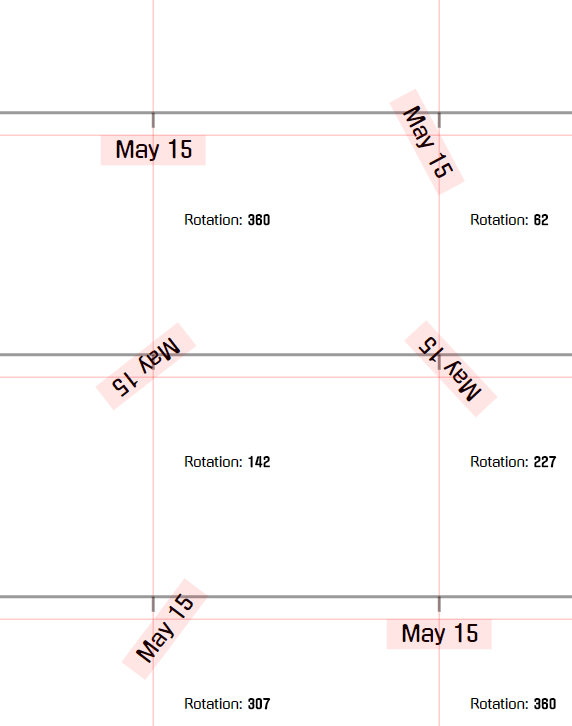
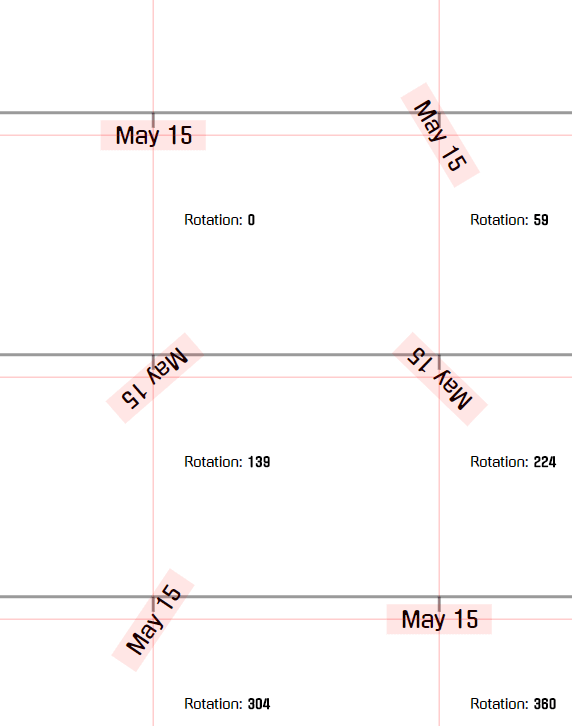
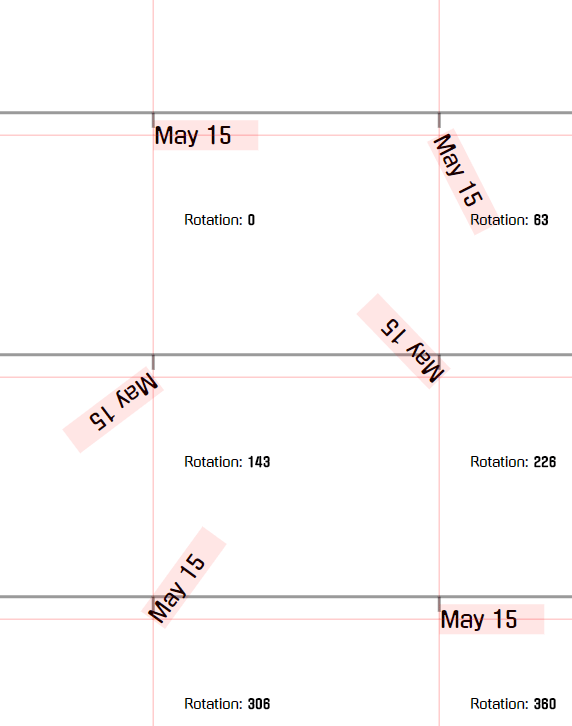
Here’s how the rotation works with out default centering options: