This tutorial will show how you can easily create a “3D stack” effect on regular LineSeries.
Let’s take this chart as an example:
* ---------------------------------------
* This demo was created using amCharts 4.
* For more information visit:
* https://www.amcharts.com/
* Documentation is available at:
* https://www.amcharts.com/docs/v4/
* ---------------------------------------
am4core.useTheme(am4themes_animated);
var chart = am4core.create("chartdiv", am4charts.XYChart);
for (var i = 1; i < 200; i++) {
value1 += Math.random() * 10;
value2 += Math.random() * 15;
value3 += Math.random() * 20;
date: new Date(2018, 0, i),
var dateAxis = chart.xAxes.push(new am4charts.DateAxis());
dateAxis.renderer.grid.template.location = 0;
var valueAxis = chart.yAxes.push(new am4charts.ValueAxis());
valueAxis.tooltip.disabled = true;
valueAxis.renderer.minWidth = 35;
function createSeries(field, index, count) {
var series = chart.series.push(new am4charts.LineSeries());
series.dataFields.dateX = "date";
series.dataFields.valueY = field;
series.tooltipText = "{valueY}";
series.tooltip.pointerOrientation = "vertical";
series.tooltip.background.fillOpacity = 0.5;
createSeries("value1", 0, 3);
createSeries("value2", 1, 3);
createSeries("value3", 2, 3);
chart.cursor = new am4charts.XYCursor();
chart.cursor.snapToSeries = series;
chart.cursor.xAxis = dateAxis;
var scrollbarX = new am4core.Scrollbar();
chart.scrollbarX = scrollbarX;
<div id="chartdiv"></div>
-apple-system, BlinkMacSystemFont, "Segoe UI", Roboto, Helvetica, Arial, sans-serif,
"Apple Color Emoji", "Segoe UI Emoji", "Segoe UI Symbol";
3d-line-series
Bit of a mess.
It would help, if we somehow would be able make each individual LineSeries stand out.
The first step is to go from regular XYChart to its 3D descendant - XYChart3D:
var chart = am4core.create("chartdiv", am4charts.XYChart3D);chart.depth = 200;
var chart = am4core.create("chartdiv", am4charts.XYChart3D);chart.depth = 200;
var chart = am4core.createFromConfig({ "depth": 200, // ...}, "chartdiv", am4charts.XYChart3D);
That enables 3D, but does not help us much:
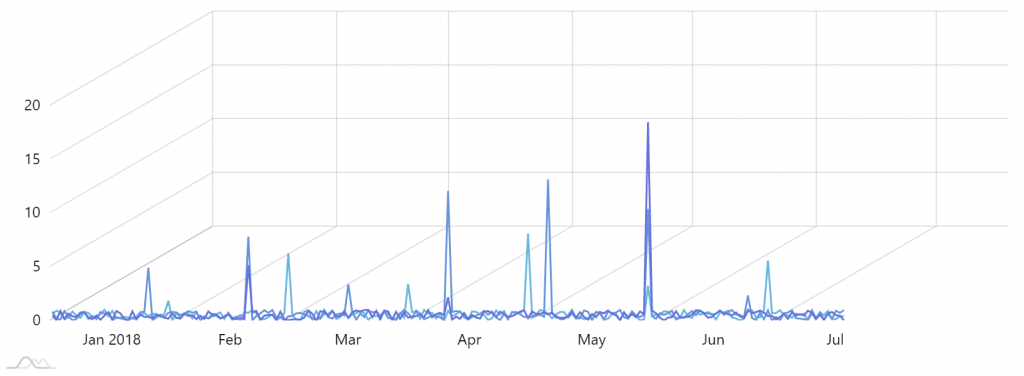
The chart does not automatically shift LineSeries, so we’ll need to do it ourselves.
Luckily, position of literally anything in amCharts 4 can be fine-tuned using dx and dy properties.
So if we wanted to shift a series upwards and to the right, we could do something like this:
series.dx = 20;series.dy = -20;
series.dx = 20;series.dy = -20;
{ // ... "series": [{ // ... "dx": 20, "dy": -20 }]}
This will shift the series 20 pixels to the right, and 20 pixels upwards.
That said, hard-coding positions is for wussies, right? Let’s automatically calculate the dx and dy based on the number of series and series index:
series.dx = chart.depth / (count) * am4core.math.cos(chart.angle) * index;series.dy = -chart.depth / (count) * am4core.math.sin(chart.angle) * index;
series.dx = chart.depth / (count) * am4core.math.cos(chart.angle) * index;series.dy = -chart.depth / (count) * am4core.math.sin(chart.angle) * index;
{ // ... "series": [{ // ... // We don't need to offset the first series "dx": 0, "dy": 0 }, { // … "dx": 200 / (3) * am4core.math.cos(30) * 1, "dy": -200 / (3) * am4core.math.sin(30) * 1 }, { // … "dx": 200 / (3) * am4core.math.cos(30) * 2, "dy": -200 / (3) * am4core.math.sin(30) * 2 }]}
* ---------------------------------------
* This demo was created using amCharts 4.
* For more information visit:
* https://www.amcharts.com/
* Documentation is available at:
* https://www.amcharts.com/docs/v4/
* ---------------------------------------
am4core.useTheme(am4themes_animated);
var chart = am4core.create("chartdiv", am4charts.XYChart3D);
for (var i = 1; i < 200; i++) {
value1 += Math.random() * 10;
value2 += Math.random() * 15;
value3 += Math.random() * 20;
date: new Date(2018, 0, i),
var dateAxis = chart.xAxes.push(new am4charts.DateAxis());
dateAxis.renderer.grid.template.location = 0;
var valueAxis = chart.yAxes.push(new am4charts.ValueAxis());
valueAxis.tooltip.disabled = true;
valueAxis.renderer.minWidth = 35;
function createSeries(field, index, count) {
var series = chart.series.push(new am4charts.LineSeries());
series.dataFields.dateX = "date";
series.dataFields.valueY = field;
series.tooltipText = "{valueY}";
series.tooltip.pointerOrientation = "vertical";
series.tooltip.background.fillOpacity = 0.5;
series.fillOpacity = 0.2;
series.dx = (chart.depth / count) * am4core.math.cos(chart.angle) * index;
series.dy = (-chart.depth / count) * am4core.math.sin(chart.angle) * index;
createSeries("value1", 0, 3);
createSeries("value2", 1, 3);
createSeries("value3", 2, 3);
chart.cursor = new am4charts.XYCursor();
chart.cursor.snapToSeries = series;
chart.cursor.xAxis = dateAxis;
var scrollbarX = new am4core.Scrollbar();
chart.scrollbarX = scrollbarX;
<div id="chartdiv"></div>
-apple-system, BlinkMacSystemFont, "Segoe UI", Roboto, Helvetica, Arial, sans-serif,
"Apple Color Emoji", "Segoe UI Emoji", "Segoe UI Symbol";
3d-line-series-2 
