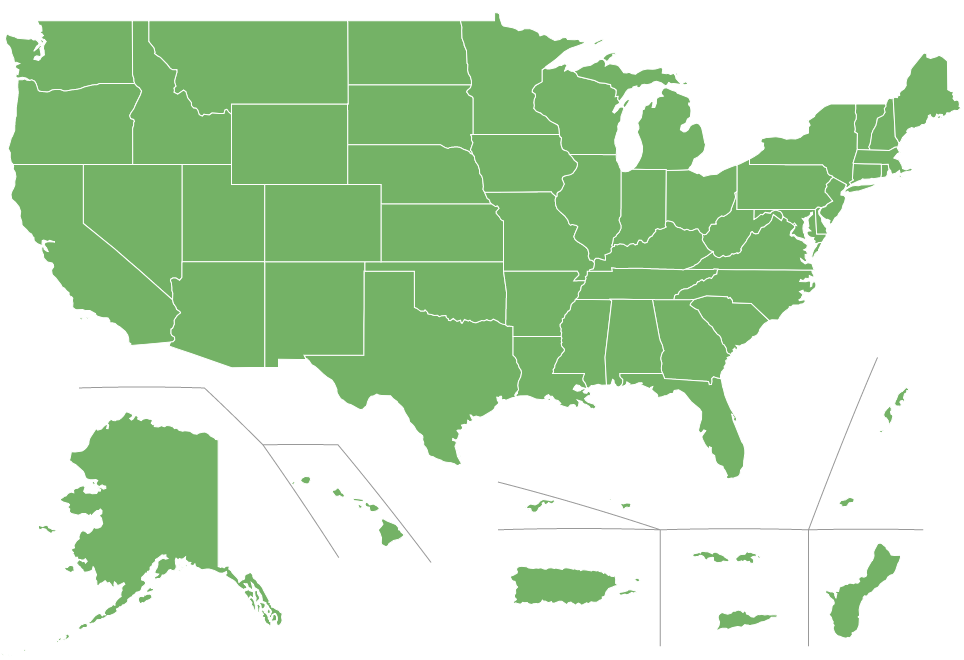
Some maps, bundled with amCharts 4, such as “U.S. territories” come with built-in separator lines. This tutorial will explain how to enable and configure them.
GeoJSON format, which we use for our maps, allows including not only areas (polygons), but also line information. They may be used for a variety of reasons, i.e. separating displaced polygons, indicating that they were deliberately moved for aesthetic purposes.
The most notable example is a variety of distorted U.S. maps with some of the island states and territories displayed below the mainland map:
A map of U.S. states and territories At this time we have two maps that have separators embedded:
usaTerritories
usaTerritories2
Let’s try creating a simple map with usaTerritories.
* ---------------------------------------
* This demo was created using amCharts 4.
* For more information visit:
* https://www.amcharts.com/
* Documentation is available at:
* https://www.amcharts.com/docs/v4/
* ---------------------------------------
var chart = am4core . create ( " chartdiv " , am4maps . MapChart );
chart . geodata = am4geodata_usaTerritoriesLow ;
chart . projection = new am4maps . projections . Miller ();
// Create map polygon series
var polygonSeries = chart . series . push ( new am4maps . MapPolygonSeries ());
polygonSeries . useGeodata = true ;
var polygonTemplate = polygonSeries . mapPolygons . template ;
polygonTemplate . tooltipText = " {name} " ;
polygonTemplate . fill = am4core . color ( " #74B266 " );
// Create hover state and set alternative fill color
var hs = polygonTemplate . states . create ( " hover " );
hs . properties . fill = am4core . color ( " #367B25 " );
< div id = " chartdiv " ></ div >
-apple-system , BlinkMacSystemFont, " Segoe UI " , Roboto, Helvetica , Arial , sans-serif ,
" Apple Color Emoji " , " Segoe UI Emoji " , " Segoe UI Symbol " ;
Using separators using-separatorsAll the territory polygons appear, but… “look ma, no separators”!
Separator lines are (shocker) not polygons. They are lines, hence they do not appear as part of the MapPolygonSeries.
To enable those lines, we will need to create another series - MapLineSeries.
let separatorSeries = chart . series . push ( new am4maps . MapLineSeries ());separatorSeries . useGeodata = true ;
var separatorSeries = chart . series . push ( new am4maps . MapLineSeries ()); separatorSeries . useGeodata = true ;
{ // ... "series": [{ "type": "MapPolygonSeries", // ... }, { "type": "MapLineSeries", "useGeodata": true }]}
Let’s see how our map looks now.
* ---------------------------------------
* This demo was created using amCharts 4.
* For more information visit:
* https://www.amcharts.com/
* Documentation is available at:
* https://www.amcharts.com/docs/v4/
* ---------------------------------------
var chart = am4core . create ( " chartdiv " , am4maps . MapChart );
chart . geodata = am4geodata_usaTerritoriesLow ;
chart . projection = new am4maps . projections . Miller ();
// Create map polygon series
var polygonSeries = chart . series . push ( new am4maps . MapPolygonSeries ());
polygonSeries . useGeodata = true ;
var polygonTemplate = polygonSeries . mapPolygons . template ;
polygonTemplate . tooltipText = " {name} " ;
polygonTemplate . fill = am4core . color ( " #74B266 " );
// Create hover state and set alternative fill color
var hs = polygonTemplate . states . create ( " hover " );
hs . properties . fill = am4core . color ( " #367B25 " );
// Configure separator line series
var separatorSeries = chart . series . push ( new am4maps . MapLineSeries ());
separatorSeries . useGeodata = true ;
< div id = " chartdiv " ></ div >
-apple-system , BlinkMacSystemFont, " Segoe UI " , Roboto, Helvetica , Arial , sans-serif ,
" Apple Color Emoji " , " Segoe UI Emoji " , " Segoe UI Symbol " ;
Using separators using-separators-2There they are.
Final step in our short tutorial is learning how to configure our separators.
Technically, separators are just like any other line series. So you can configure them using mapLines.template.
Let’s just see how we can easily change color of the lines.
separatorSeries . mapLines . template . stroke = am4core . color ( " #999 " );
separatorSeries . mapLines . template . stroke = am4core . color ( " #999 " );
{ // ... "series": [{ "type": "MapPolygonSeries", // ... }, { "type": "MapLineSeries", "useGeodata": true, "mapLines": { "stroke": "#999" } }]}
* ---------------------------------------
* This demo was created using amCharts 4.
* For more information visit:
* https://www.amcharts.com/
* Documentation is available at:
* https://www.amcharts.com/docs/v4/
* ---------------------------------------
var chart = am4core . create ( " chartdiv " , am4maps . MapChart );
chart . geodata = am4geodata_usaTerritoriesLow ;
chart . projection = new am4maps . projections . Miller ();
// Create map polygon series
var polygonSeries = chart . series . push ( new am4maps . MapPolygonSeries ());
polygonSeries . useGeodata = true ;
var polygonTemplate = polygonSeries . mapPolygons . template ;
polygonTemplate . tooltipText = " {name} " ;
polygonTemplate . fill = am4core . color ( " #74B266 " );
// Create hover state and set alternative fill color
var hs = polygonTemplate . states . create ( " hover " );
hs . properties . fill = am4core . color ( " #367B25 " );
// Configure separator line series
var separatorSeries = chart . series . push ( new am4maps . MapLineSeries ());
separatorSeries . useGeodata = true ;
separatorSeries . mapLines . template . stroke = am4core . color ( " #999 " );
< div id = " chartdiv " ></ div >
-apple-system , BlinkMacSystemFont, " Segoe UI " , Roboto, Helvetica , Arial , sans-serif ,
" Apple Color Emoji " , " Segoe UI Emoji " , " Segoe UI Symbol " ;
Using separators using-separators-3